maandag 12 november 2012

Energy revolution

Innovation is the most powerful key to a more prosperous world. Innovation will drastically change the world. How drastically, well read and be surprised, the energy revolution has begun!

Over the last fifty years, we see a steadily increased consumption of oil, which may represent our global prosperity [1,2]. In these 50 years we see only three times a decline in yearly oil consumption:

In 1973, being the first oil crisis, resulting from the Yom Kippur war, lasting for two years.
In 1978 being the second oil crisis, resulting form the Persian revolution lasting four years.
In 2008 being the US banking crises, lasting two years.


In the same timespan, the yearly average oil price has developed as [3]:


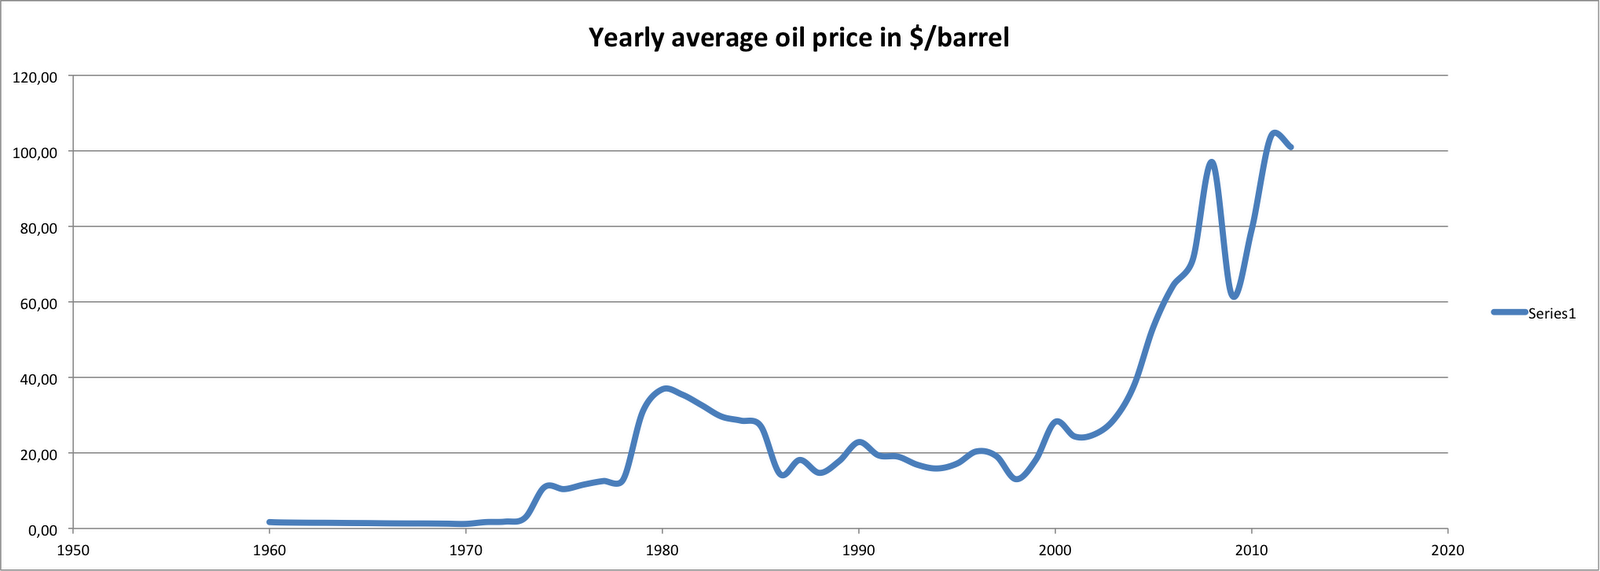
Also in this figure, the first and second oil crises can be seen, as is the 2008 US banking crisis. Further the price has fallen considerably after the 1986 crash, after the 1998 asian banking crisis and after the 2000 burst of the dot com bubble. Further we can see the extreme price surge from the 2003 US invasion in Iraq, and to a much less extend the invasion of Iraq in kuwait in 1990.

What is more fascinating, is that both price and consumption go up over time. The more we use, the more we pay.

We may think that for coal this price development is different, well it is not [3]:


Here again the big drop in coal price is seen following the US banking crisis.

To be complete, the natural gas prices show an image slightly different, though with similar implication [3]:


So all our fossil energy sources show at least a tenfold increase in price since the mid 70ties. This might arguably be the result of a heavily inflating dollar, well maybe not. Opposed to these price development, silicon poly-crystalline solar cell prices has almost constantly dropped. This development has evolved irrespective of any oil crisis and irrespective of any country invading another [4]:


Consequently: in the same time all fossil energy prices went up more than ten fold, PV cell prices went down a factor 100. Furthermore the trends are that fossil fuels will get more expensive, whereas Photovoltaic energy will get less expensive.


No wonder that the amount of installed (peak) capacity of PV power is exponentially rising [1]:


If the S-curve fit is expanded into the future, we will see that the installed peak PV capacity will reach and surpass our electrical energy consumption already in 2024 [1].


This is very good news! It means abundant and cheap energy. It means less incentives to start wars in the gulf region. It means far less carbon dioxide emissions. It means a much cleaner environment.

Thank you technology for making this possible! Thank you inventors of this technology. Thank you, silicon industry for ever producing more and better available silicon!!!

THANK YOU!!!!!


literature/sources:

[1] Statistical review of the world energy 2012, BP

 http://www.bp.com/sectionbodycopy.do?categoryId=7500&contentId=7068481

[2] IEA highlights October 2012

http://omrpublic.iea.org/currentissues/full.pdf

[3] World Bank pink sheets 2012, world prices of commodities and indices, historical data

http://econ.worldbank.org/WBSITE/EXTERNAL/EXTDEC/EXTDECPROSPECTS/0,,contentMDK:21574907~menuPK:7859231~pagePK:64165401~piPK:64165026~theSitePK:476883,00.html

[4]  Re-considering the Economics of Photovoltaic Power, M. Bazilian e.a. (May 2012)

http://www.newenergyfinance.com/WhitePapers/view/82

donderdag 25 oktober 2012

Patent density

Driven by pure curiousity, I 've wondered what the patent density around the world would look like.

From datasets made available by gapminder [1], it is posible to calculate the number of patents in force per capita. For the top 45 countries the results are shown below, wherein the abscis is expressed in a logarithmic scale.


I thought, that the patent density would be an great indicator for e.g. prosperity of a nation.... well seen the astonishing 7 granted patents per capita in Gibraltar, more than 1000 times the patent density in Japan, this figure more reflects the size of the country than anything else.

What does this patent density tell us?  Well the amount of protected patents does not even reflect the amount of infringement cases. In Canada for instance, with about 10,4 active patent rights in force per 1000 inhabitants, less infringement cases are brought to court than in the USA with about 4,3 active patents per 1000 inhabitants. So this indicator is not indicative for infringement behaviour. 

Furthermore, the fact that Swasiland, with a relative low developed technology has a higher patent density than e.g. Switserland, Japan and the USA indicates that patent density isn't a great indicator for drawing any conclusions on prosperity or technology advancement levels of a country...

I can only conclude that patent density is a very lousy indicator. Too bad....

maandag 17 september 2012

Photovoltaic power production growth

My believe is that innovation is the most powerfull key to a more prosperous world. The following game changing development is a nice example how innovation will bring about prosperity.

According a Forbes study form last summer an additional 59 GW of photovoltaic solar cells will be produced in 2012 [1]. If this produced amount becomes actually installed in 2012, the total installed photovoltaic power generating capacity will reach 132 GW at years end.

This is truly and absolutely fascinating! My earlier estimated date of full replacement of traditional power generation [2] will even be reached sooner. This is VERY GOOD NEWS!!!! It is pretty rewarding to see year after year that my forecasts are pretty accurate, yet still on the conservative side.


When the above fitted curve of growth of globally installed photovoltaic cells is compared with the global amount of consumed power, in 2024 a full replacement can be predicted [2].


If the production estimates of Forbes is accurate, we might even sooner, before 2024, have gotten rid of most mineral fuel and nuclear fuel powered electricity production. WHAT A NEWS!


[1] http://www.forbes.com/sites/uciliawang/2012/06/27/report-solar-panel-production-will-far-exceed-demand-beyond-2012/

[2] http://octrooifabriek.blogspot.nl/2012/05/we-will-innovate-our-way-out-of_24.html

dinsdag 5 juni 2012

Innovation PV power forecasts

In a recent report on solar power by McKinsey, the most positive forecast on global photovoltaic power is a total installed capacity of 700 GW in the year 2020 [1].

If we fit that data in my forecast, being a fitted S-curve, it shows as follows:

If my predictions are right, which I hope so, the very positive forecast of McKinsey is way too conservative still. In my model, it is early 2017 that an installed PV power of 700 GW is reached. In the year 2020, my model predicts a fourfold amount of global installed PV power, compared to the McKinsey predictions.


Only future may tell who is right.....


[1] http://www.mckinsey.com/Client_Service/Sustainability/Latest_thinking/Solar_powers_next_shining 

donderdag 24 mei 2012

We will innovate our way out of recession II

Any technological innovation follows a very specific growth path, the development of global electrical energy consumption being no exception. This growth path can be accurately plotted by taking the global electrical energy consumed over the years and fitting an S-type growth curve on the data [4]. When done, the global electrical energy consumption is presented in the following figure:

Figure 1; the global electrical energy consumed [GW]


Despite the fact that the data has been collected from three different data sources, and thus some unwanted irregularities may be given, an S-curve can be properly fitted [1], [2], [3].

The first key parameter of the fitted S-curve is the year 2030, being the tipping point, when the enhanced consumption growth will stop and the growth of consumption will start to diminish. The second key parameter of the fitted S-curve is the total maximum amount of electrical energy consumed, being 19500 GW, about 3,3 times the amount that is consumed today. Will the planet be able to supply this amount of energy and absorb the related carbon dioxide emissions? Probably not.

Likewise, the production of solar photovoltaic cells will follow a similar growth path, with its own specific key parameters. A representation of the data, being the total global PV power installed, and the fitted S-curve is represented in the following figure [2]:

Figure 2; the global installed PV power [GW]

The first key parameter of the fitted S-curve is the year 2024, where the fitted curve will find its tipping point. The second key parameter of the curve is the maximum amount of PV energie produced, which is about 15000 GW, 2,5 times the electrical energy now consumed. Ironically, the data provided for the total global photovoltaic power installed, was provided by British Petrol, the very same company that decided last winter to exit photovoltaic cell production. Puzzling indeed!


The fascinating and very good news is, that provided both fits are to some extend reliable, the following effects will show:


The astonishing conclusions are:

Photovoltaic electricity production, now being a mere 1 percent of the total electrical energy consumption, will be a significant source of power within only few years from now. PV power will already be sufficiently large to fully supply the total electrical energy consumption in 2024.

Within 12 years from now most fossil AND nuclear fuel fired electrical power stations are becoming obsolete!

The total electricity production will be abundant, relatively cheap and fully sustainable in the very near future. We will soon experience a far cleaner planet.

These effects are market driven, government have rather little influence on these developments.

The global debt crisis, imposed on us by governments relaxing the legal restrictions to allow unsustainable and irresponsible growth of debts and deepened by banks gearing up vast and unsustainable debts will be solved by the installation and deployment of an entirely new industry. Ironically it will not be solved by those responsible, it will be solved by scientists, technicians, engineers, producing industries and their investors, who innovate, design, develop and produce PV cells, the electrical energy storage and the power grid,  and those who invest in this upcoming PV industry.


We will innovate our way out of recession!

Yes, we will!


PS an alternative and promising power storage is being developed, see the inspiring presentation of Donald Sadoway [5]

[1]    http://www.iea.org/textbase/nppdf/free/2010/key_stats_2010.pdf

[2]    BP Statistical Review of World EnergyJune 2011
         http://www.bp.com/sectiongenericarticle800.do?categoryId=9037156&contentId=7068663

[3]    http://en.wikipedia.org/wiki/Photovoltaics

[4]    http://www.slideshare.net/HendrikdeLange/s-curve-presentation-wwwcrowdfundersnl

[5]    http://www.ted.com/talks/donald_sadoway_the_missing_link_to_renewable_energy.html

We will innovate our way out of recession I

In one of my earlier posts, I have shown that the expansion of total debt in the United States has virtually come to a stand still. Most probably, in Europe the very same flat line off total debt development will be shown. Despite the enormous gouvernemental injections of new freshly printed money, the total debt will not increase anymore. Thus, the additional money inserted by governments Quantitative Easing will be fully absorbed by existing debts in entities, cities, insurance companies, family households, retirement funds and predominantly banks redeeming their debts and shrinking their balance sheets.

So the vast debts made are shifted to the public domain, on the tax payers account. These taxpayers will on a global scale face a considerable increase in taxes and a decrease in public services like good education, a properly working health system and well maintained infrastructure.  Since the taxpayer will thus loose a considerable amount of purchasing power, less will be consumed and less money will be spend.

What this means is that no additional funding will be available, and that the existing and potentially shrinking amount of money need to be shared amongst us. A strong and potentially lasting deflation period is likely to occur. This results in more competition for money at all levels: money for loans, money for capital investments and money from clients buying products or services. A hoarding of money will occur, simply because the very same money will have a higher value tomorrow.

The competition for money is most likely be won by those enterprises that produce a better balance between quality and price of their products or services. The balance between quality and price can only be improved by continuous innovation and proper protection of this innovation.

Accordingly, in this competition, only those companies that innovate and protect their innovations well will be able to win this competition for money. This money is again is needed and used for properly expanding their business. Accordingly innovation, more specific protected innovation will be the engine pulling enterprises, their employees, the tax collecting authorities and finally all of us both locally and globally out of the recession.

That innovation needs protection is obvious, in order to reward innovators a temporary monopoly for their efforts invested. Would on the other hand innovation easily be copied, once it has proven successfully, it will lead to a direct punishment to the very innovators who took the risk of investing time and resources in innovation in the first place.

In that light a properly functioning and affordable patent system, which is affordable for the private inventor, SME's and large corporate enterprises and a transparent patent marketplace is essential.

A transparent marketplace for innovations is not yet available. It is my firm believe that a transparent market place for innovations should be developed by a commercial party, very much as the stock exchanges are organized. Most likely this will be a global platform where innovations can be obtained, invested in and auctioned. In the years 2005-2010, it appeared that the US based company Ocean Tomo was heading for such open, transparent and globally accessible auction based market place. Nowadays the patent auctioneering part is sold to ICAP and within this company a more closed and secrete atmosphere around the auctions is generated, where auction data are no longer given out or published.

An affordable patent system implies as little procedural effort and as little expenditure as possible for a high quality patent. Such that innovators can optimally invest their resources in innovation and market deployment. A unified European Patent system would reduce procedural efforts and reduce costs to about 20% of the current expenses for obtaining pan European protection.

However, in Europe, some countries are still actively blocking the development of a unified European Patent system, thereby inhibiting our pan European chances of exiting the upcoming recession. To those states I can only say: SHAME ON YOU ITALY, SHAME ON YOU SPAIN FOR BLOCKING THIS DOOR TO A MORE PROSPEROUS FUTURE OF EUROPE. [1]

In the light of the upcoming recession, I hereby appeal to European governments to invest in innovation by simplifying the European patent system to one unified patent, being trialled in one unified court [2]. Most preferably, this court should be in the European state with most patent applications and most infringement cases, being Germany.

If this is not possible within the EU (what strongly appears to be the case), than maybe it is time to dust off the old EPLA (European Patent Law Agreement) in order to circumvent EU blocking tactics, starting with a small number of signatory states, similar to the EPC (European Patent Convention). Most likely the first signatory states are: Belgium, Luxemburg, France, Germany, England and the Netherlands, exactly those states that exerted the efforts to draft a European patent convention. It only needs to be finished!


literature

[1] http://www.euractiv.com/innovation-enterprise/italy-spain-take-patent-fight-court-news-505264

[2] http://en.wikipedia.org/wiki/European_Union_patent

woensdag 23 mei 2012

IPO of Facebook

IPO of Facebook

Any technological innovation follows a very specific growth path, Facebook being no exception. This growth path can be accurately plotted by taking the numbers provided by Facebook. In Facebook's case only the number of (active) Facebook users were given out regularly, last six years or so. On these figures an S-curve can be fitted, and thus a accurate future development of the number of users can be predicted [1]. 


On the basis of these figures, all made publicly available by Facebook, a maximum number of Facebook users can be accurately assessed. This number will be approximately 1Billion (1 x 10^9).  Today, the number of Facebook users is 900 Million, and is therefore likely to grow only another 10 percent in the next couple of years. 

In this light, and given the fact that the per user revenue in 2011 is about 4.34$, the next years a revenue of about 4.34 billion $ can be expected. This may generate about 1.4 Billion $ profit, provided the (considerable) 2011 profit margin of 30% remains [2]. 

This reflects a fair company value of about 20 billion, one fifth of the company value appraised at the IPO. 

So it is my prediction that the Facebook shares will drop to about one fifth of the IPO price of 38$, being still a fair price. 

Anyone claiming that their paid introduction price was too high, and they were falsely informed, well they should remain silent, the figures presented herein above were publicly available long before the IPO.  To Facebook I can only give my deepest respect, that they were able to collect such a high price for their in my view highly over rated stock.